Twelve dashboards
Four College Friends: the $60B Cursor deal.
Four MIT friends built the fastest revenue ramp in software history, lost money on every customer while doing it, and sold to SpaceX for $60 billion. The ramp, the negative margin, the closed ring of investors and the deal itself, charted, with every figure sourced on the frame.
Read the article Cursor: How Four 25-Year-Olds Sold Their Startup to Elon Musk for $60 Billion →How to read these
Every dashboard carries a source chip in its lower-left corner, and the distinction is deliberate.
- Primary Stated by the company, filed with the SEC (the Form 8-K share count) or published by the model providers themselves.
- Reported Sourced to journalism: Bloomberg, The Information, CNBC, TechCrunch, Fortune. Attribution is printed on the dashboard itself, not just here.
- Estimate Analyst or survey modelling (Sacra, Ramp, JetBrains, Forbes) or our own arithmetic on reported figures. Marked as an estimate every time it appears.
Cursor never filed an S-1. Churn, net revenue retention, the seed valuation and 2026 headcount were never disclosed and are not charted. The −23% gross margin and the ~$900M loss originate with The Information and are credited on every frame that shows them.
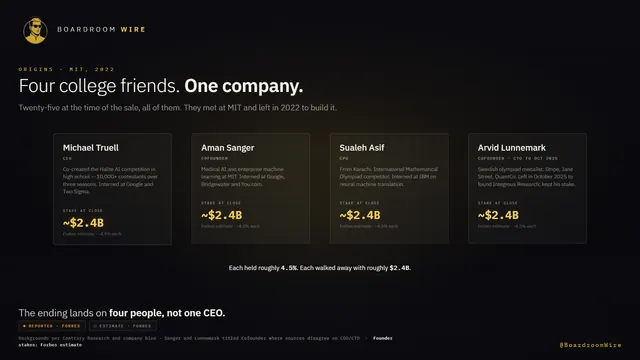
The Founding Four
Four plates, four founders. Each held roughly 4.5% of the company, and each walked away with about $2.4 billion.
Origins Estimate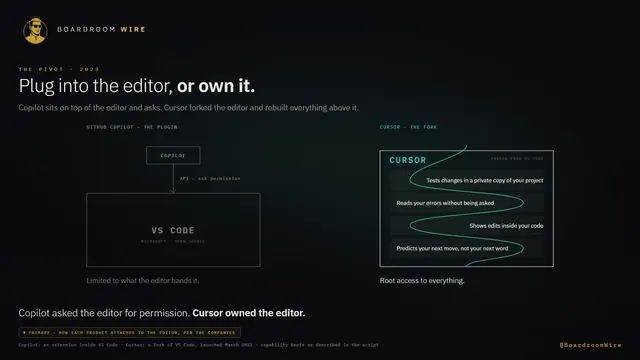
The Fork
GitHub Copilot sat on top of the editor and asked permission. Cursor forked the editor and owned every layer. The asymmetry is the whole strategy.
The pivot Primary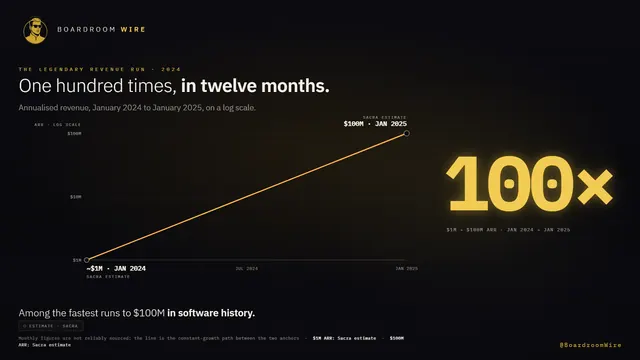
The 100× Year
From about $1 million to $100 million in twelve months, on a log scale so the ramp reads as a ramp.
The revenue run Estimate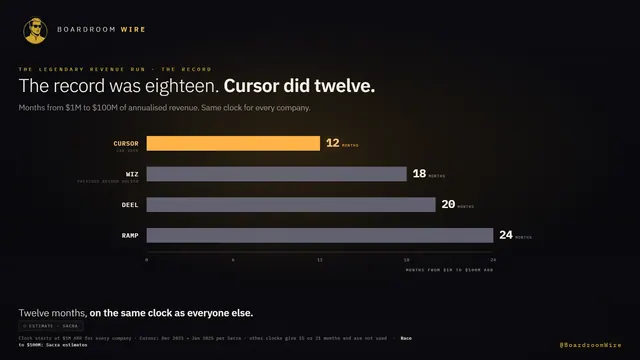
Race to $100M
Months from $1M to $100M ARR, on the same clock for everyone: Ramp 24, Deel 20, Wiz 18, Cursor 12.
The revenue run Estimate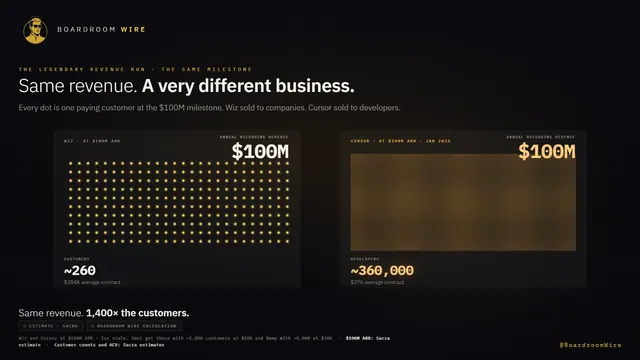
Same Milestone, Different Business
Wiz reached $100 million with about 260 customers. Cursor reached it with about 360,000. Same revenue, 1,400× the customers, a very different business.
The revenue run Estimate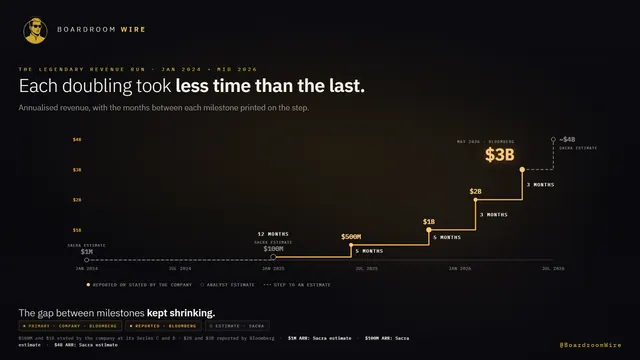
The Full Ramp
Every milestone from $1M to $3B with the interval printed on each riser. Each doubling took less time than the last.
The revenue run Reported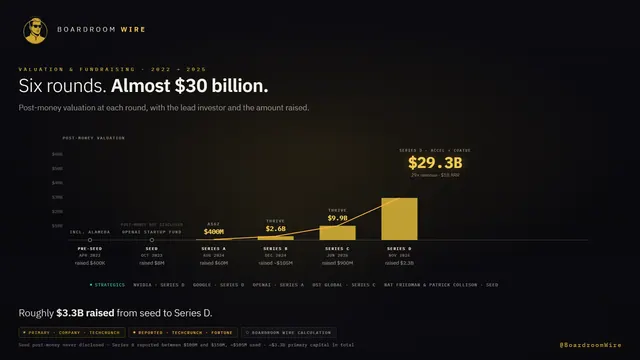
The Funding Ladder
Seed to Series D: six rounds, roughly $3.3 billion raised, a $29.3 billion valuation, and a deliberate gap on the right of the frame.
Valuation Primary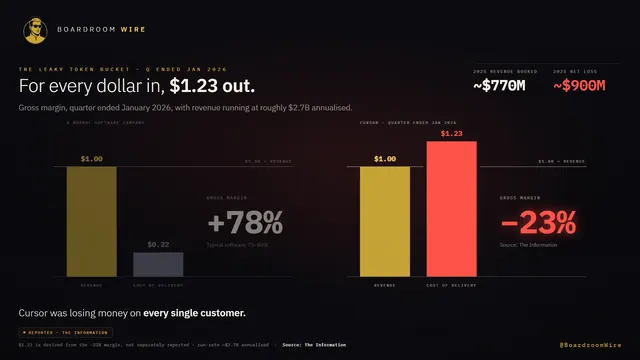
Where the Dollar Goes
For every dollar of revenue, $1.23 of cost. The cost bar breaks through the chart’s own frame; a normal software company sits beside it for scale.
The leaky token bucket Reported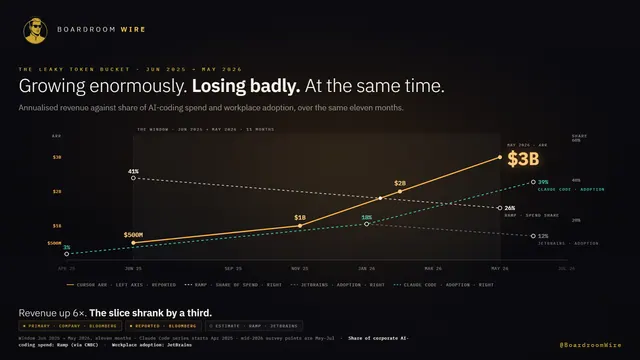
Revenue Up, Share Down
Revenue went from $500 million to $3 billion while share of corporate AI-coding spend fell from 41% to 26%. The lines cross.
The leaky token bucket Reported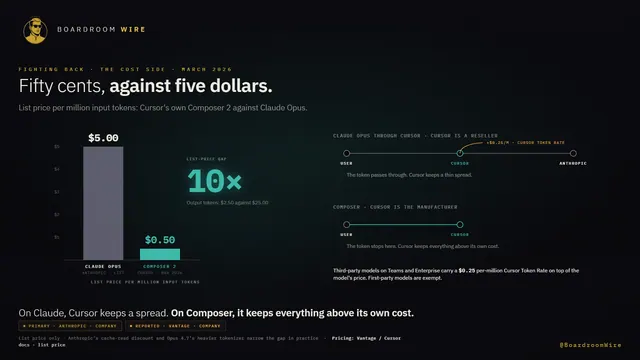
Composer vs Opus
$0.50 against $5.00 per million tokens at list price, and why Cursor keeps a spread on Claude but keeps everything on Composer.
Fighting back Reported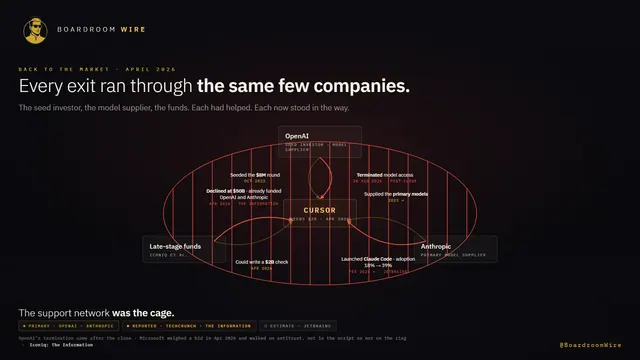
The Trap
Every exit Cursor could take led back to the same handful of companies: its seed investor, its model supplier, the funds that had already backed both.
Back to the market Reported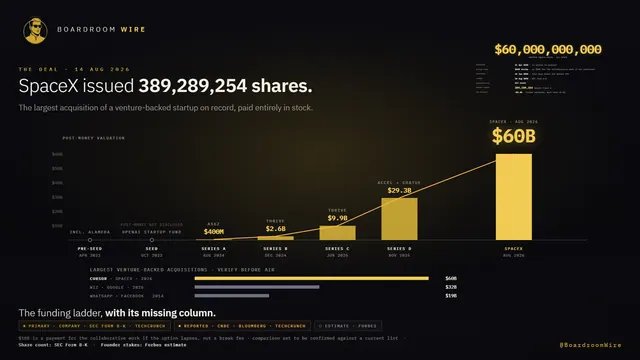
The Deal
$60,000,000,000 and 389,289,254 shares, in full, then the funding ladder returns with its missing column filled in.
The deal Primary