Research & Analysis
The charts behind the reporting.
Every Boardroom Wire investigation is built on primary documents. These are the dashboards that came out of them: individually citable, and marked throughout with where each number came from.
Eleven dashboards · October 3, 2026
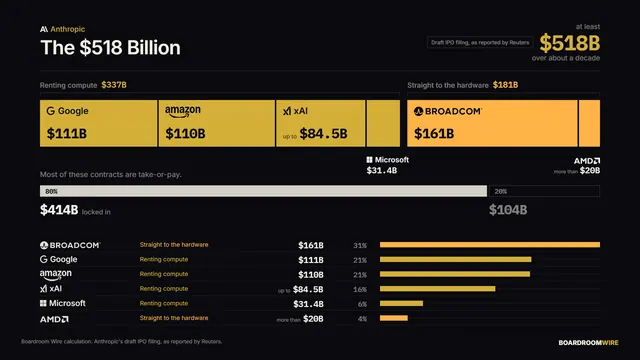
Inside Anthropic's $518 Billion Bet
Anthropic lost $42 billion in 2025 and has signed up to spend at least $518 billion on compute. How the revenue really looks, what the loss was made of, where the money goes, how it plans to pay, and what a $2 trillion IPO price rests on, charted from its draft IPO filing as Reuters reported it.
Open the collection → Read the article →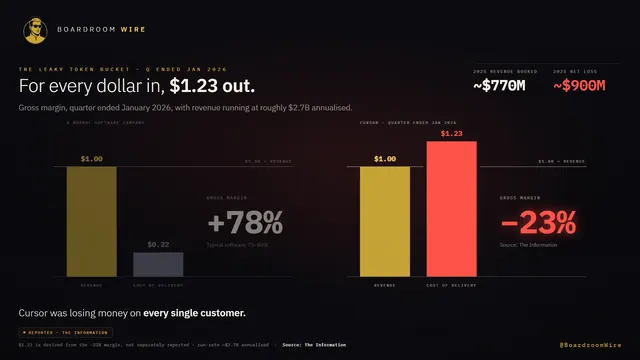
Twelve dashboards · September 14, 2026
Four College Friends: The $60B Cursor Deal
Four MIT friends built the fastest revenue ramp in software history, lost money on every customer while doing it, and sold to SpaceX for $60 billion. The ramp, the negative margin, the closed ring of investors and the deal itself, charted, with every figure sourced on the frame.
Open the collection → Read the article →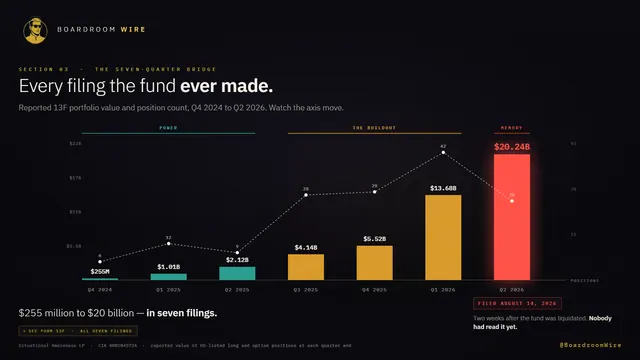
Fourteen dashboards · August 24, 2026
Situational Awareness: The $45B Blowup
Leopold Aschenbrenner raised $225 million, compounded it past $20 billion, and lost most of it in twenty-nine days. Every filing the fund ever made, charted, plus the mechanics of how a 25% drawdown became a 100% loss.
Open the collection → Read the article →